
White Papers - DVX-100 Gamma September 1, 2003
DVX-100 Gamma Settings
By Dan Coplan
There's a lot of mystery surrounding the four gamma settings available on the Panasonic DVX-100 miniDV camcorder. The options are "NORMAL", "LOW", "HIGH", and the intriguing "CINE" setting which is hyped as more "filmic". Stymied myself with what these options actually offer, I set out upon a scientific approach to gain a better understanding of how these various gammas affect the camera and its images.
I set up my DVX-100 on a tripod square to a DSC Labs 11-step Front Box chip chart and ran a firewire cable from the camera to Final Cut Pro on my iBook. I used the waveform monitor available in FCP's "Log and Capture" mode to insure the chart was evenly lit and to analyze the luminance levels being read by the camera.
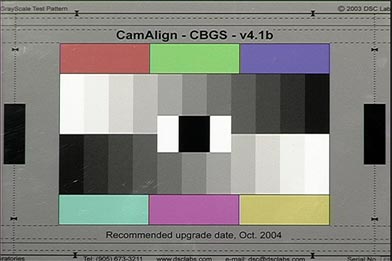
Using the camera's linear CINE gamma setting (more about that in a sec...) and the waveform monitor, I optimized the latitude of the camera by exposing the white chips on the chart to read right around 100 IRE. I then dialed down the camera's MASTER PEDESTAL to -9, the point at which the blacks hit 0 IRE without crushing. The result and the standard to which I measured the other three gamma settings is shown below...CINE gamma
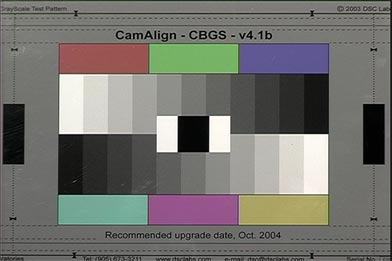
Rather than employing any sort of curve/compression in the toe (shadow region) or shoulder/knee (highlight region) which is what you find naturally in film and electronically in video to better manage the rapidly diminishing detail on either end of the spectrum, CINE gamma provides a linear response to the camera's input.
You can see this on the chart as the progression of chip luminance values appears to increase/decrease in equal amounts and this can be verified by the adjacent waveform reading that displays fairly evenly spaced luminance values with the crossover (the middle gray chip shared as a common value between the upper and lower row of chips) just a smidge higher than 50 IRE or true middle gray.
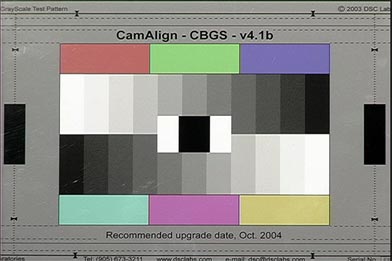
NORMAL gamma
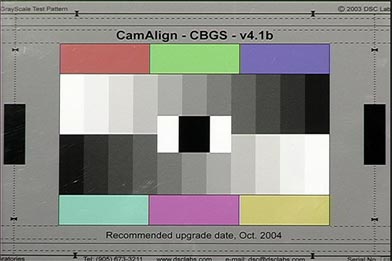
With NORMAL gamma you'll notice right away that the highlights in the chart get a whole lot more highlightier (a very non-technical term that I just made up on the fly). In the CINE chart, there's a very clear separation between the two brightest chips whereas with this NORMAL chart, the chips come very close to blending together. The chart appears brighter overall and while the pure black still seems pretty black, it looks as if though the shadow region begins to stretch up to higher values.
Looking at the waveform monitor, we can analytically verify what we're seeing with our eyes. I sampled the two brightest chips in the CINE chart right around 96 and 87 IRE. In this NORMAL chart these two values come in at 99 and 96. You can also see that the values begin to compress, an indication of decreasing detail. The crossover bumped up approximately 10 IRE, compressing and reducing contrast in the upper gamma and highlight region, stretching out and increasing contrast in the lower gamma and shadow region, and resulting in an overall brighter image.
LOW gamma
It's hard to tell what LOW gamma does. The chart and waveform monitor look very similar to NORMAL. The values I sampled are almost identical in the highlight and shadow regions while the most significant change, which isn't saying much, is in the mid gamma. The greatest difference is in the crossover point which is lower by roughly 5 IRE.
HIGH gamma
Again, it's hard to tell what's going on with the HIGH gamma setting. The waveform monitor indicates common crossover and highlight values. The difference both in the waveform monitor and in the values I sampled indicate a stretching up of the lower gamma and shadow region, but only by a few IRE.
This is the chart I plotted based on pixel sampling from the video captured chip chart. Nearly common values are shared in the shadow region and then the separation between CINE gamma and the other three very similar gammas begins.
* Check out my article on "Over/Underexposing Video"
Copyright ©2003. Dan Coplan.
This article was originally published at DanCoplan.com and is reprinted here with permission.
All screen captures, images, and textual references are the property and trademark of their creators/owners/publishers.